Writing a NodeRed flow to determine when my pool will be at an acceptable temperature using the sun and maths

I'm one of the lucky ones to have a pool at my home. But I never know when it's actually hot enough for me to go in, and having the ability to know in advance would be wonderful, since I could plan my day more easily.
We put our pool on the south-east corner of our property (which means it get sunlight for the whole day) and has a "bubble cover" that help them heat up in the sun.
I already have temperature sensors in my pool, yes sensors one at the top and one at the bottom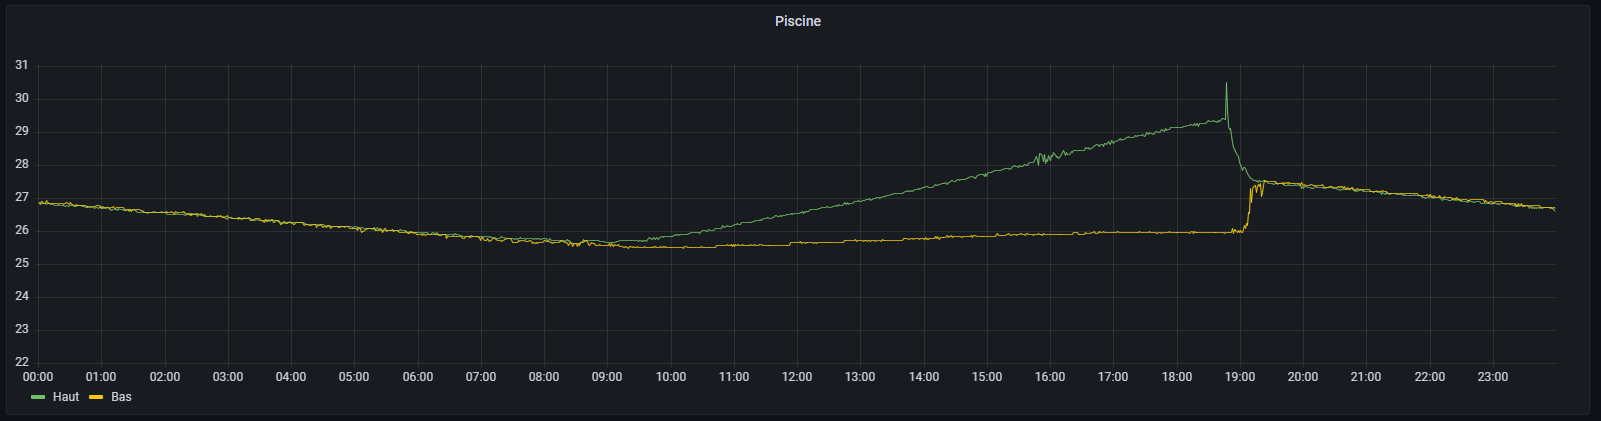
You can see at 18h45 the pump turning on and mixing the water (which takes about 30min).
You can also see that the temps start rising around 9h30 in a pretty linear way. A bit of digging later, and this time correlates with the sun elevation going over 35deg, which is the angle at which it starts covering almost all the pool.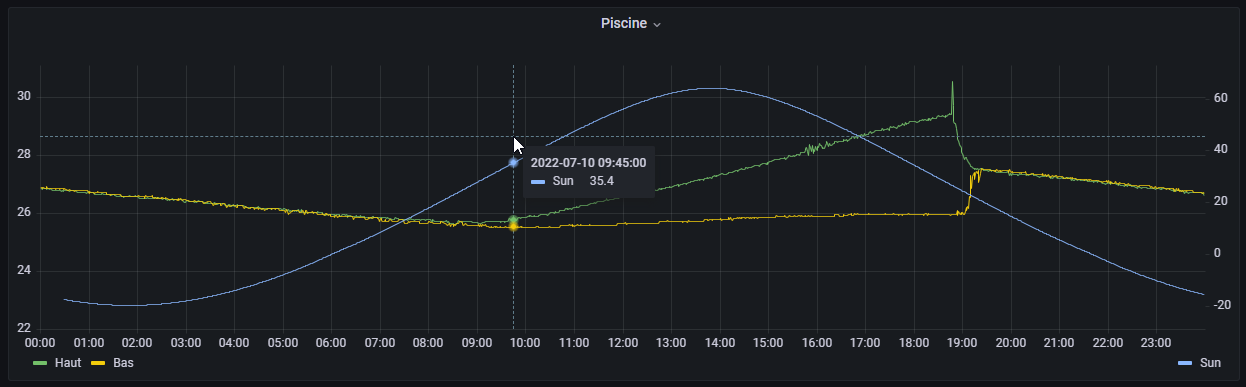
After verifying this theory by checking day by day that it actually matches (at least somewhat, I don't want something precise to the second, just to the half hour), I started to work on predicting the temp.
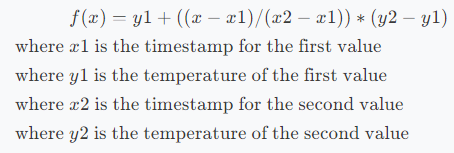
Since the temperature rise is pretty linear, I went with a very basic linear interpolation between two points.
This also means that as I'm not using a fancy Ai to determine the temp, I can't do it before I have an acceptable value for the first and second point which I randomly set at 10h30
On the 11 of July 2022 where I live, the sun attained 35deg at approximatively 9h28 (± 5 min)
At 9h28, the top pool sensor reported a temperature of approximatively 25.72degC.
At 10h30, the sensor reported a temperature of approximatively 26.06degC.
The timestamp for 9h29 being 1657438080s and the timestamp for 10h30 being 1657441800s
Let's say I want the temperature at 16h30 (1657452600) we can use the previous defined formula like this: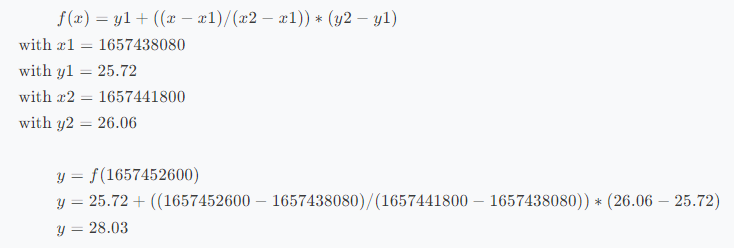
Let's check the results, according to the sensor, at 16h30 the temp was 28.49degC, neither a bad result nor a perfect one. A .5degC deviation is a high, but this was approximatively one hour after it started to heat up, it can't be that precise.
Doing the calculation again using the temperature at 14h00 for x2 & y2 results in a prediction of 28.3degC which I find acceptable for such a crude solution
As I wanted to keep things simple (says the man writing code to predict the pool temperature), I used node red, which is a remarkable tool for quickly manipulating data or a stream of data.
In the middle of building the flow, I thought that it might be a good idea to have a floating x2 & y2. I decided to use the last value gathered by the sensor (with a limit of 17h00 to avoid issues with the pump). So, I went ahead and rewrote most of it.
First part is an inject node that start at 10h00 and triggers every 10min until 17h00, that then feed through a function node that sets some constants:
1msg.desired_temp = 28.25
2var d = new Date();
3msg.query_start_time = d.toISOString().substr(0,11) + "00:00:00.000Z"
4msg.query_stop_time = d.toISOString().substr(0,11) + "23:59:59.999Z"
5return msg;
I then use the template node to build the query and the influxdb in node to retrieve the data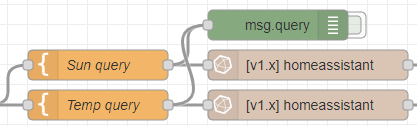
 1SELECT
 2    mean("elevation") AS "mean_elevation"
 3FROM
 4    "homeassistant"."autogen"."sun.sun"
 5WHERE
 6    time > '{{query_start_time}}' AND
 7    time < '{{query_stop_time}}'
 8GROUP BY
 9    time(30s)
10FILL(linear)
The query for the temperature is almost the same except for the GROUP BY using time(60s), you'll see later why this is "needed".
This query gives a result similar to this (null meaning the sensor didn't have a value at the time):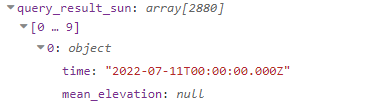
I then immediately enter a function node to get the time when the sun reached 35deg
35deg store it in the message object and return it.
1for(let point of msg.payload) {
2    if (point.mean_elevation > 35) {
3        msg.sun_35deg_localtime = (new Date(Date.parse(point.time))).toLocaleTimeString()
4        msg.sun_35deg_iso       = point.time
5        msg.sun_35deg_exact     = point.mean_elevation
6        return msg
7    }
8}
I then need to join the two separates messages from the two queries into one. The simplest way to do it I found is to use a join node configured to expect two messages and return one array as the payload, followed by a function node to re-organize it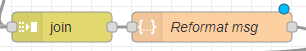
And this is why I used two different time groups in the query on array will be bigger than the other. It's very hacky, but works, I'm welcome to a suggestion (using a topic as the key pop's in my mind)
1if(msg.payload[0].length > msg.payload[1].length) {
2    msg.query_result_sun = msg.payload[0]
3    msg.query_result_temp = msg.payload[1]
4} else {
5    msg.query_result_sun = msg.payload[1]
6    msg.query_result_temp = msg.payload[0]
7}
8delete msg.query
9return msg;
Originally, I planned to smooth out the temperature to get a more accurate reading, that proved wildly ineffective and decreased the accuracy by approximatively 3degC, here is the code for the node anyway (it's a basic low-pass/smoothing function):
 1// Deepclone
 2msg.query_result_temp_smooth = JSON.parse(JSON.stringify(msg.query_result_temp))
 3
 4let smoothing = 40;
 5
 6var value = msg.query_result_temp_smooth[0].temp_top; // start with the first input
 7for (var i=1, len=msg.query_result_temp_smooth.length; i<len; ++i){
 8    var currentValue = msg.query_result_temp_smooth[i].temp_top;
 9    if(currentValue) {
10        value += (currentValue - value) / smoothing;
11        msg.query_result_temp_smooth[i].temp_top = value;
12    }
13 }
14return msg;
Next, the data goes to another function node to extract the temp when the sun is at 35deg and the temp either now or at 17h00: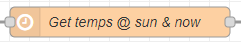
17h00 and 09h00, I reverse the data and added a simple condition to check the hours (this means that, right now, it will get the value around 17h59, not an issue though).
 1let timeSun = Date.parse(msg.sun_35deg_iso)
 2
 3for(let point of msg.query_result_temp) {
 4    let time = Date.parse(point.time)
 5    if (time > timeSun) {
 6        msg.temp_at_sun = point.temp_top
 7        msg.temp_at_sun_time = point.time
 8        msg.temp_at_sun_time_local = new Date(time).toLocaleTimeString()
 9        break
10    }
11}
12
13for(let point of msg.query_result_temp.reverse()) {
14    let timestamp = Date.parse(point.time)
15    let time = new Date(Date.parse(point.time))
16    if (time.getHours() <= 17 && time.getHours() > 9 && !!point.temp_top) {
17        msg.temp_at_now_or_1700 = point.temp_top
18        msg.temp_at_now_or_1700_time = point.time
19        msg.temp_at_now_or_1700_time_local = time.toLocaleTimeString()
20        break
21    }
22}
23return msg
Now that we have our constants for the linear interpolation, we can use another function node, to create the values:
start, stop and step time for the interpolation. Next, we use the function defined in the last part and create the dataset, assign it to the message object (along with the constants) and return it.
 1let interpolation_start = Date.parse(msg.query_start_time)
 2let interpolation_stop = Date.parse(msg.query_stop_time)
 3let interpolation_step = 1 * 60 * 1000
 4
 5let x1 = Date.parse(msg.temp_at_sun_time)
 6let y1 = msg.temp_at_sun
 7let x2 = Date.parse(msg.temp_at_now_or_1700_time)
 8let y2 = msg.temp_at_now_or_1700
 9
10let array = []
11for(let x=interpolation_start; x<interpolation_stop; x+=interpolation_step) {
12    array.push({
13        time: new Date(x).toISOString(),
14        interpolation: y1 + ((x - x1) / (x2 - x1)) * (y2 - y1)
15    })
16}
17
18msg.interpolation_params = { x1, y1, x2, y2 }
19msg.interpolated_temp = array
20
21return msg
The next step is to get when the top of the pool will be at 28.25degC. To accomplish that, I use yet another function node and use the same code as I used to get the temps at a specific time, the only difference being that I search for the time instead of temperature. I also added a little margin to make sure I catch a value.
NB: I cloud have done the proper thing here and calculate an equation that take a temperature and return a timestamp, but it's 3am 🛏️ and don't really need it in this instance.
 1for(let point of msg.interpolated_temp) {
 2    let time = Date.parse(point.time)
 3    if (point.interpolation > msg.desired_temp-0.12 && point.interpolation < msg.desired_temp+0.12) {
 4        msg.desired_temp_time       = time
 5        msg.desired_temp_time_local = new Date(time).toLocaleTimeString()
 6        msg.desired_temp_time_iso   = new Date(time).toISOString()
 7        msg.desired_temp_actual     = point.interpolation
 8    }
 9}
10return msg
The last step is visualization, the first thing that happens is that the message goes into a function node that will round all the values to an acceptable decimal point (2 for the values and 6 for the interpolation parameters)
Then, it goes into multiple function & template nodes that then goes into multiple UI nodes, a debug node and an homeassistant sensor node: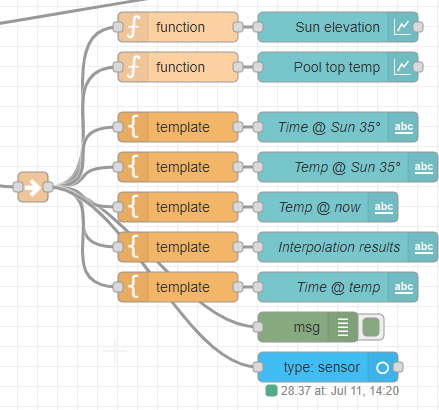
And that gives me a nice NodeRed dashboard: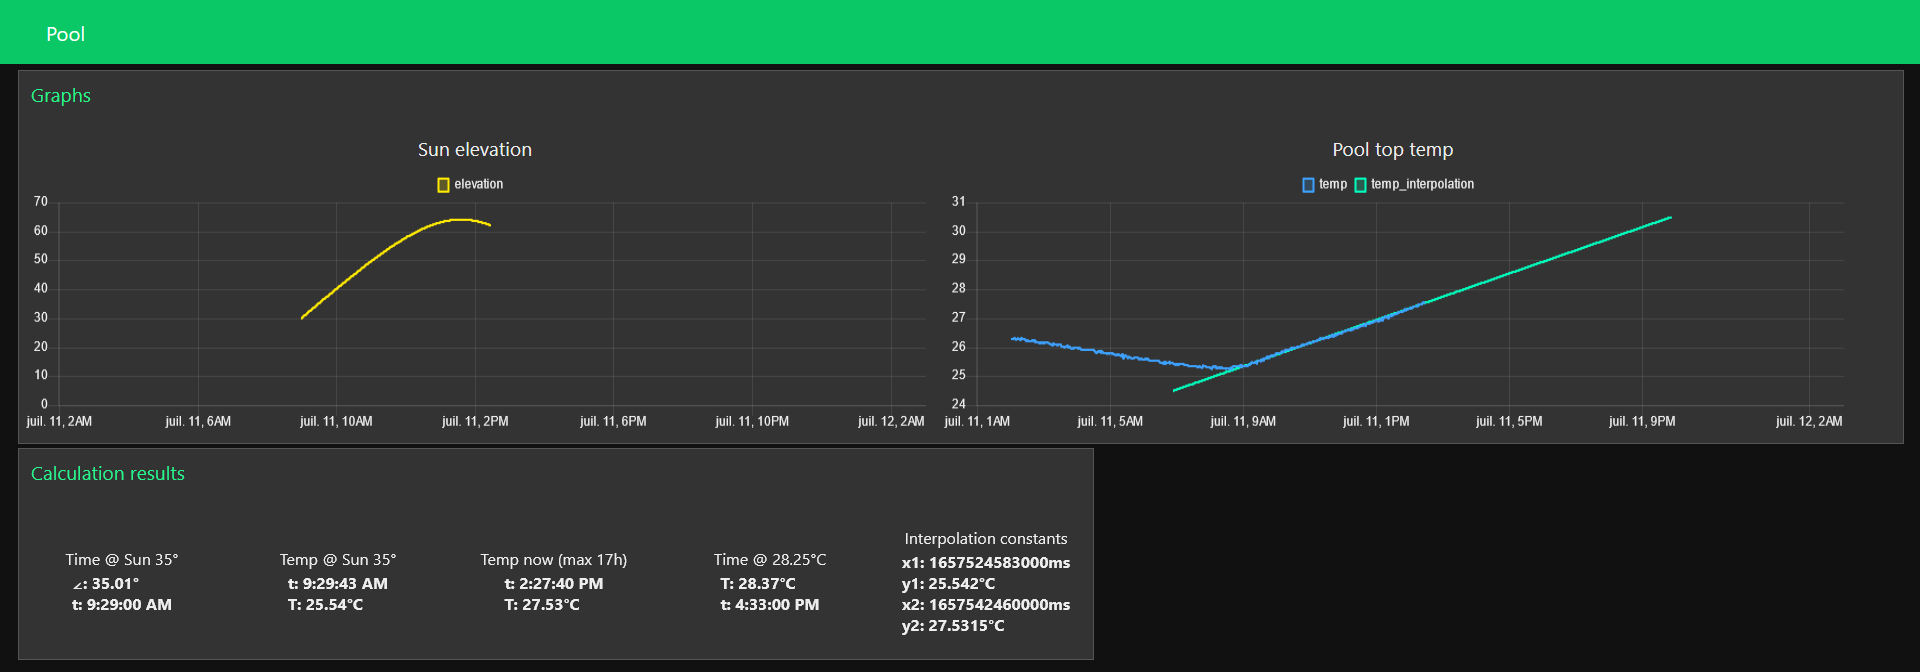
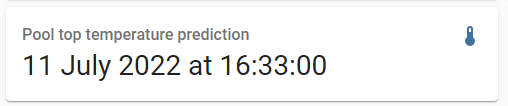
And you can see that (at least when I wrote this article) the prediction pretty much spot on. The ha sensor does his job and can be visualized in the dashboard: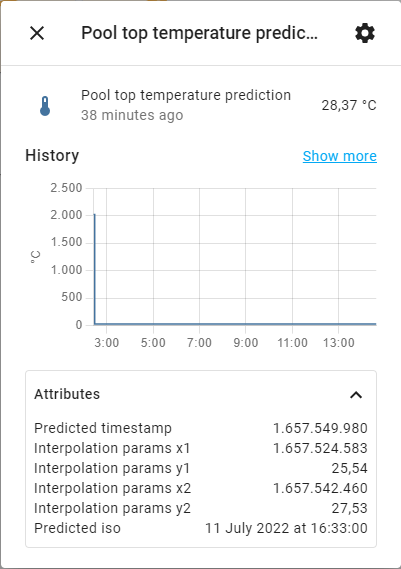
This was done as an experiment and for fun when I noticed that the temperature curve was somewhat linear, not as an actual statistical analysis that I would actually rely on. I'm not a maths head either, there are probably better ways to do this.
To get the actual temperature of the pool, I would need to do some more maths to average the top and bottom sensor, I, however, do no care 😅.
Things I learned:
If you want the flow, email me (see my portfolio), I'll send it to you. If you would like to chat about it or other projects, please join my discord (https://discord.com/invite/z8bwtdE) or directly comment below 😄
Want to chat about this article? Just post a message down here. Chat is powered by giscus and all discussions can be found here: TheStaticTurtle/blog-comments